Key Takeaways
Unified KPIs consolidate critical manufacturing metrics into a single system—enabling teams to detect production issues up to 70% faster than traditional disconnected tracking methods.
- Unified KPIs eliminate data silos by connecting ERP, MES, and quality systems into one centralized dashboard, replacing manual spreadsheet consolidation with real-time automated updates.
- Start small and expand strategically by focusing on 5-8 high-impact metrics like OEE, throughput, and on-time delivery before gradually adding more KPIs as your team gains confidence.
- Standardize definitions across departments using a KPI dictionary with clear ownership, calculation methods, and data sources to prevent conflicting performance narratives.
- Design role-specific dashboards that limit metrics to 5-9 items per screen, using visual hierarchy to enable five-second status comprehension and immediate action on exceptions.
- Measure ROI through time savings and decision speed by tracking both direct benefits like reduced reporting hours and indirect gains from faster response to production bottlenecks.
The real value of unified KPIs isn’t in the data you collect—it’s in the decisions you make faster. When your manufacturing production software connects planning with actual shop floor performance, lagging reports become proactive tools that directly impact delivery, quality, and operational efficiency.
What if your manufacturing production software could cut the time to detect production issues by up to 70%?
Real-time KPI dashboards make that possible. Yet many manufacturers still rely on disconnected metrics scattered across departments, making it nearly impossible to spot bottlenecks before they impact delivery.
Unified KPIs change that. Consolidating critical metrics like OEE, cycle time, and on-time delivery into a single production KPI dashboard means your team acts on current data—not last week’s report.
This guide walks you through building a unified KPI system, step by step.
Understanding Unified KPIs in Manufacturing Production Software
What Makes KPIs ‘Unified’ vs Traditional Tracking
Traditional manufacturing KPIs operate in isolation. Quality metrics live in one system, production counts in another, and equipment status in a third. When leadership needs a complete picture, someone spends hours manually combining exports from separate systems. Sound familiar?
Unified KPIs work differently. They pull from a centralized data repository where production events, quality checks, and equipment performance connect automatically. When a machine stops, that downtime immediately affects schedule adherence, capacity utilization, and on-time delivery calculations—without anyone lifting a finger.
The distinction matters more than it might seem. If your system updates on a daily or weekly batch cycle, your manufacturing KPIs are describing the past, not the present. A calibration drift that goes unnoticed for even a few days can produce thousands of defective units before anyone reviewing a monthly report catches it. That’s not a reporting problem—that’s a real production problem.
Unified systems maintain both planned schedules from your ERP and actual production events from the shop floor. This gives you the complete equation needed to calculate schedule adherence accurately. Without capturing the actuals, you’re left guessing at the real drivers behind missed schedules.
The Role of Manufacturing Production Scheduling Software
Manufacturing production scheduling software sits at the center of unified KPI tracking. It continuously assesses operational data to identify where adjustments are necessary to stay on schedule—and it does this in real-time, not at the end of a shift.
The software calculates metrics like estimated time to completion based on actual cycle and execution data from the shop floor. Your team always knows where production stands against timelines—no manual estimates, no phone calls to the floor to check job status.
More importantly, production scheduling software maintains the relationship between planned work and actual performance. When schedule adherence dips, you can drill down into the data to uncover root causes—whether unplanned downtime, supply chain delays, or resource constraints. The system shows not just that the schedule slipped, but why it slipped.
Integration capabilities are what determine whether the software can truly unify your metrics. The platform needs to connect with ERP systems for order tracking, pull machine data for utilization calculations, and sync with quality systems for defect rates. Without that interoperability, you’re back to stitching together reports from disconnected sources.
Common Challenges with Disconnected Metrics
Most manufacturers don’t have a data problem. They have a visibility problem.
Disconnected systems increase supply chain exceptions by 1-3% and push error rates as high as 30%. Employees enter the same information into multiple systems. Reporting relies heavily on spreadsheets. Different departments maintain different versions of the same data. Production schedules don’t align with maintenance records, inventory levels lag behind real-time usage, and machine performance metrics sit in isolated dashboards that no one outside that department ever sees.
Bottlenecks rarely live inside a single department—they live in the handoffs between them. Procurement reports on-time delivery from a supplier while a bottleneck at the receiving dock quietly starves the assembly line. Nobody sees it coming because nobody has the full picture.
Manual data transfer compounds the problem. It consumes labor hours and introduces human error directly into the decision-making process. Leadership ends up relying on outdated or conflicting reports, making it nearly impossible to spot trends or get ahead of risks. When a piece of equipment begins showing early warning signs of failure, that data may never reach the maintenance team in time to prevent a breakdown.
The result? Teams spend more time collecting numbers than using them to run production. When metrics are late, inconsistent, or hard to interpret, they stop driving day-to-day decisions—and at that point, you’re managing by instinct instead of insight.
Planning Your Unified KPI Framework
Assessing Your Current Manufacturing KPIs
Before building anything new, take stock of what you already have. Examine which metrics your organization currently tracks and how teams collect that data. Look for measurements scattered across spreadsheets, reports that consistently lag behind production events, and KPIs that exist simply because they’ve always existed—not because they’re driving real decisions.
Your audit should answer a basic question: are employees entering the same information into multiple systems? When your production team, quality department, and operations manager each maintain their own version of downtime data, you’ve found exactly the problem a unified system will fix.
Focus your attention on metrics that directly influence the pain points in your manufacturing process. When metrics are unclear, outdated, or scattered across a dozen spreadsheets, you end up managing by instinct instead of insight.
Determining Which Metrics to Unify
Here’s where manufacturers often get stuck—there are simply too many possible KPIs to track. A practical starting point: break metrics into three categories.
- Value to Customer – KPIs that directly impact satisfaction and retention, such as On-Time Delivery, Throughput, and Product Quality. These reflect how well your process meets customer expectations.
- Value to Company – Metrics that affect the bottom line, including Waste Reduction, Overall Equipment Efficiency, Production Downtime, and First Pass Yield.
- Value to Employee – Measures that ensure a safe, sustainable work environment: Safety Incidents, Automation Levels, and Ergonomic Conditions.
These categories help narrow your options and get a list flowing.
From each category, choose the top one or two KPIs to start. Don’t try to track everything at once.
Also balance leading and lagging indicators. A lagging measure tells you what already happened—last week’s scrap rate, last month’s OTD. A leading measure tells you where things are headed—current machine utilization, pending material shortages. Leading indicators are anticipative in nature and can drive future performance, which makes them especially valuable for avoiding problems before they hit the shop floor.
Define each KPI using the SMART framework: specific, measurable, actionable, realistic, and time-based. Instead of “improve output,” define it as “increase production volume by 10% in the next quarter”. That kind of specificity is what makes a KPI worth tracking.
Consider running a trial period before locking in your full framework. Evaluate effectiveness and make adjustments as necessary.
Selecting Production Software with Integration Capabilities
Your manufacturing production scheduling software needs to connect directly to machine and system data. Use a machine connectivity platform to pull signals from legacy machines, PLCs, sensors, and existing MES or ERP systems—so the production dashboard updates automatically rather than waiting for someone to export a file.
Integration capabilities determine whether the software can truly unify your metrics. The platform must link with ERP for order tracking, pull machine data for utilization calculations, and sync with quality systems for defect rates.
Data standardization matters just as much as connectivity. When systems use different formats, field names, or units of measure, data exchange breaks down and inconsistencies creep in. A centralized repository resolves this by establishing one source of truth with real-time access and consistent data integrity across every department.
Creating a KPI Hierarchy and Dependencies
KPIs in a manufacturing system don’t operate independently. They have intrinsic mutual relationships, and understanding those relationships is what separates a useful KPI framework from a cluttered list of numbers.
Structure your metrics in tiers:
- Basic KPIs reveal a single aspect of performance—efficiency, quality, or availability.
- Comprehensive KPIs combine several basic KPIs to represent overall performance. Overall Equipment Effectiveness is a good example: it rolls up availability, performance efficiency, and quality into a single number.
Define the relationships and dependencies between KPIs. When throughput drops, does OEE follow? When scrap rates rise, what happens to First Pass Yield? This hierarchical structure helps you understand how actions on one metric influence others—so your team can make more informed decisions, faster.
Building Your Unified KPI System: Step-by-Step
Once your framework is planned, it’s time to put it into practice. The steps below take you from scattered data sources to a fully connected KPI system—without unnecessary complexity.
Step 1: Audit Existing Data Sources and Systems
Map every location where production data currently lives. Your ERP holds order and inventory data. Your MES tracks shop floor execution. SCADA monitors equipment status, and quality systems log defects.
Document which field comes from which source system—and how the data transforms along the way. Interviewing employees on definitions alone won’t be enough. You need to understand the actual data flows at the technical level.
During this audit:
- Identify the owner of each metric’s measurement methodology, collection process, and targets. These individuals will champion the new unified definitions.
- Prioritize KPIs that teams reference daily over those pulled quarterly for compliance reports.
- Flag any metric where two departments maintain different versions of the same number. That’s where your problems start.
Step 2: Configure Software Integrations
Connect your manufacturing production scheduling software to source systems through APIs or middleware.
- APIs establish direct connections between two systems—ideal when your requirements are straightforward.
- Middleware becomes necessary for complex connections where data requires translation and restructuring on the fly.
Your production scheduling software for manufacturing should integrate with:
- ERP for orders and inventory
- MES for production status and completions
- WMS for material availability
These connections turn business data into realistic schedules and keep plans aligned with shop floor reality.
Step 3: Standardize KPI Definitions Across Departments
Create a KPI dictionary that documents every standardized metric—its definition, calculation method, data source, and owner. This documentation gets referenced when disputes arise about what a number actually means.
Assign a single accountable owner for each enterprise-level metric. When sales and finance both claim ownership of revenue metrics but define them differently, your unified system breaks down before it even launches.
Conduct cross-functional workshops to align departmental metrics with corporate strategy. Establish clear ownership using a model that defines who creates, approves, and maintains each KPI. Without this step, you’ll have a technically integrated system that still produces conflicting reports.
Step 4: Build Your Production Dashboard Structure
Structure your production KPI dashboard in tiers based on role:
| Dashboard Level | Metrics Count | Focus |
|---|---|---|
| Shop floor displays | 5–8 real-time metrics | OEE, throughput vs. target, active downtime |
| Production managers | 10–12 daily KPIs | Past-day summaries, upcoming delivery status |
| Executive dashboards | 15–20 trended KPIs | Financial measures, improvement project ROI |
Configure each view for its specific audience. Floor managers need quick access to output data. Quality specialists prioritize defect rates. Giving everyone the same dashboard defeats the purpose of unification.
Step 5: Implement Real-Time Data Synchronization
Deploy event-driven synchronization where source systems fire webhooks when records change. The integration platform listens and immediately processes updates—moving data only when changes occur, not on a fixed schedule.
Add polling as a safety net to catch anything the event system missed during network interruptions. This two-layer approach keeps your dashboards accurate without overloading your systems.
Step 6: Create Calculation Logic and Formulas
Document every performance measure using a data definition table. For each metric, specify:
- The formula
- Data sources
- Refresh cadence
- Responsible owner
This documentation ensures metrics calculate consistently from period to period. Without it, a metric that looks like it improved may simply be calculating differently than it did last quarter.
Step 7: Deploy and Monitor Initial Performance
Train operators and supervisors before launch—not during it. Validate data accuracy through regular shift, day, and week reviews in the first few weeks.
Track lag time, error rates, and throughput for every sync pipeline. Set up alerts for anomalies so data quality issues get caught before they affect decisions. A dashboard your team doesn’t trust is a dashboard your team won’t use.
Designing Your Production KPI Dashboard for Maximum Impact
Essential Elements of an Effective Dashboard
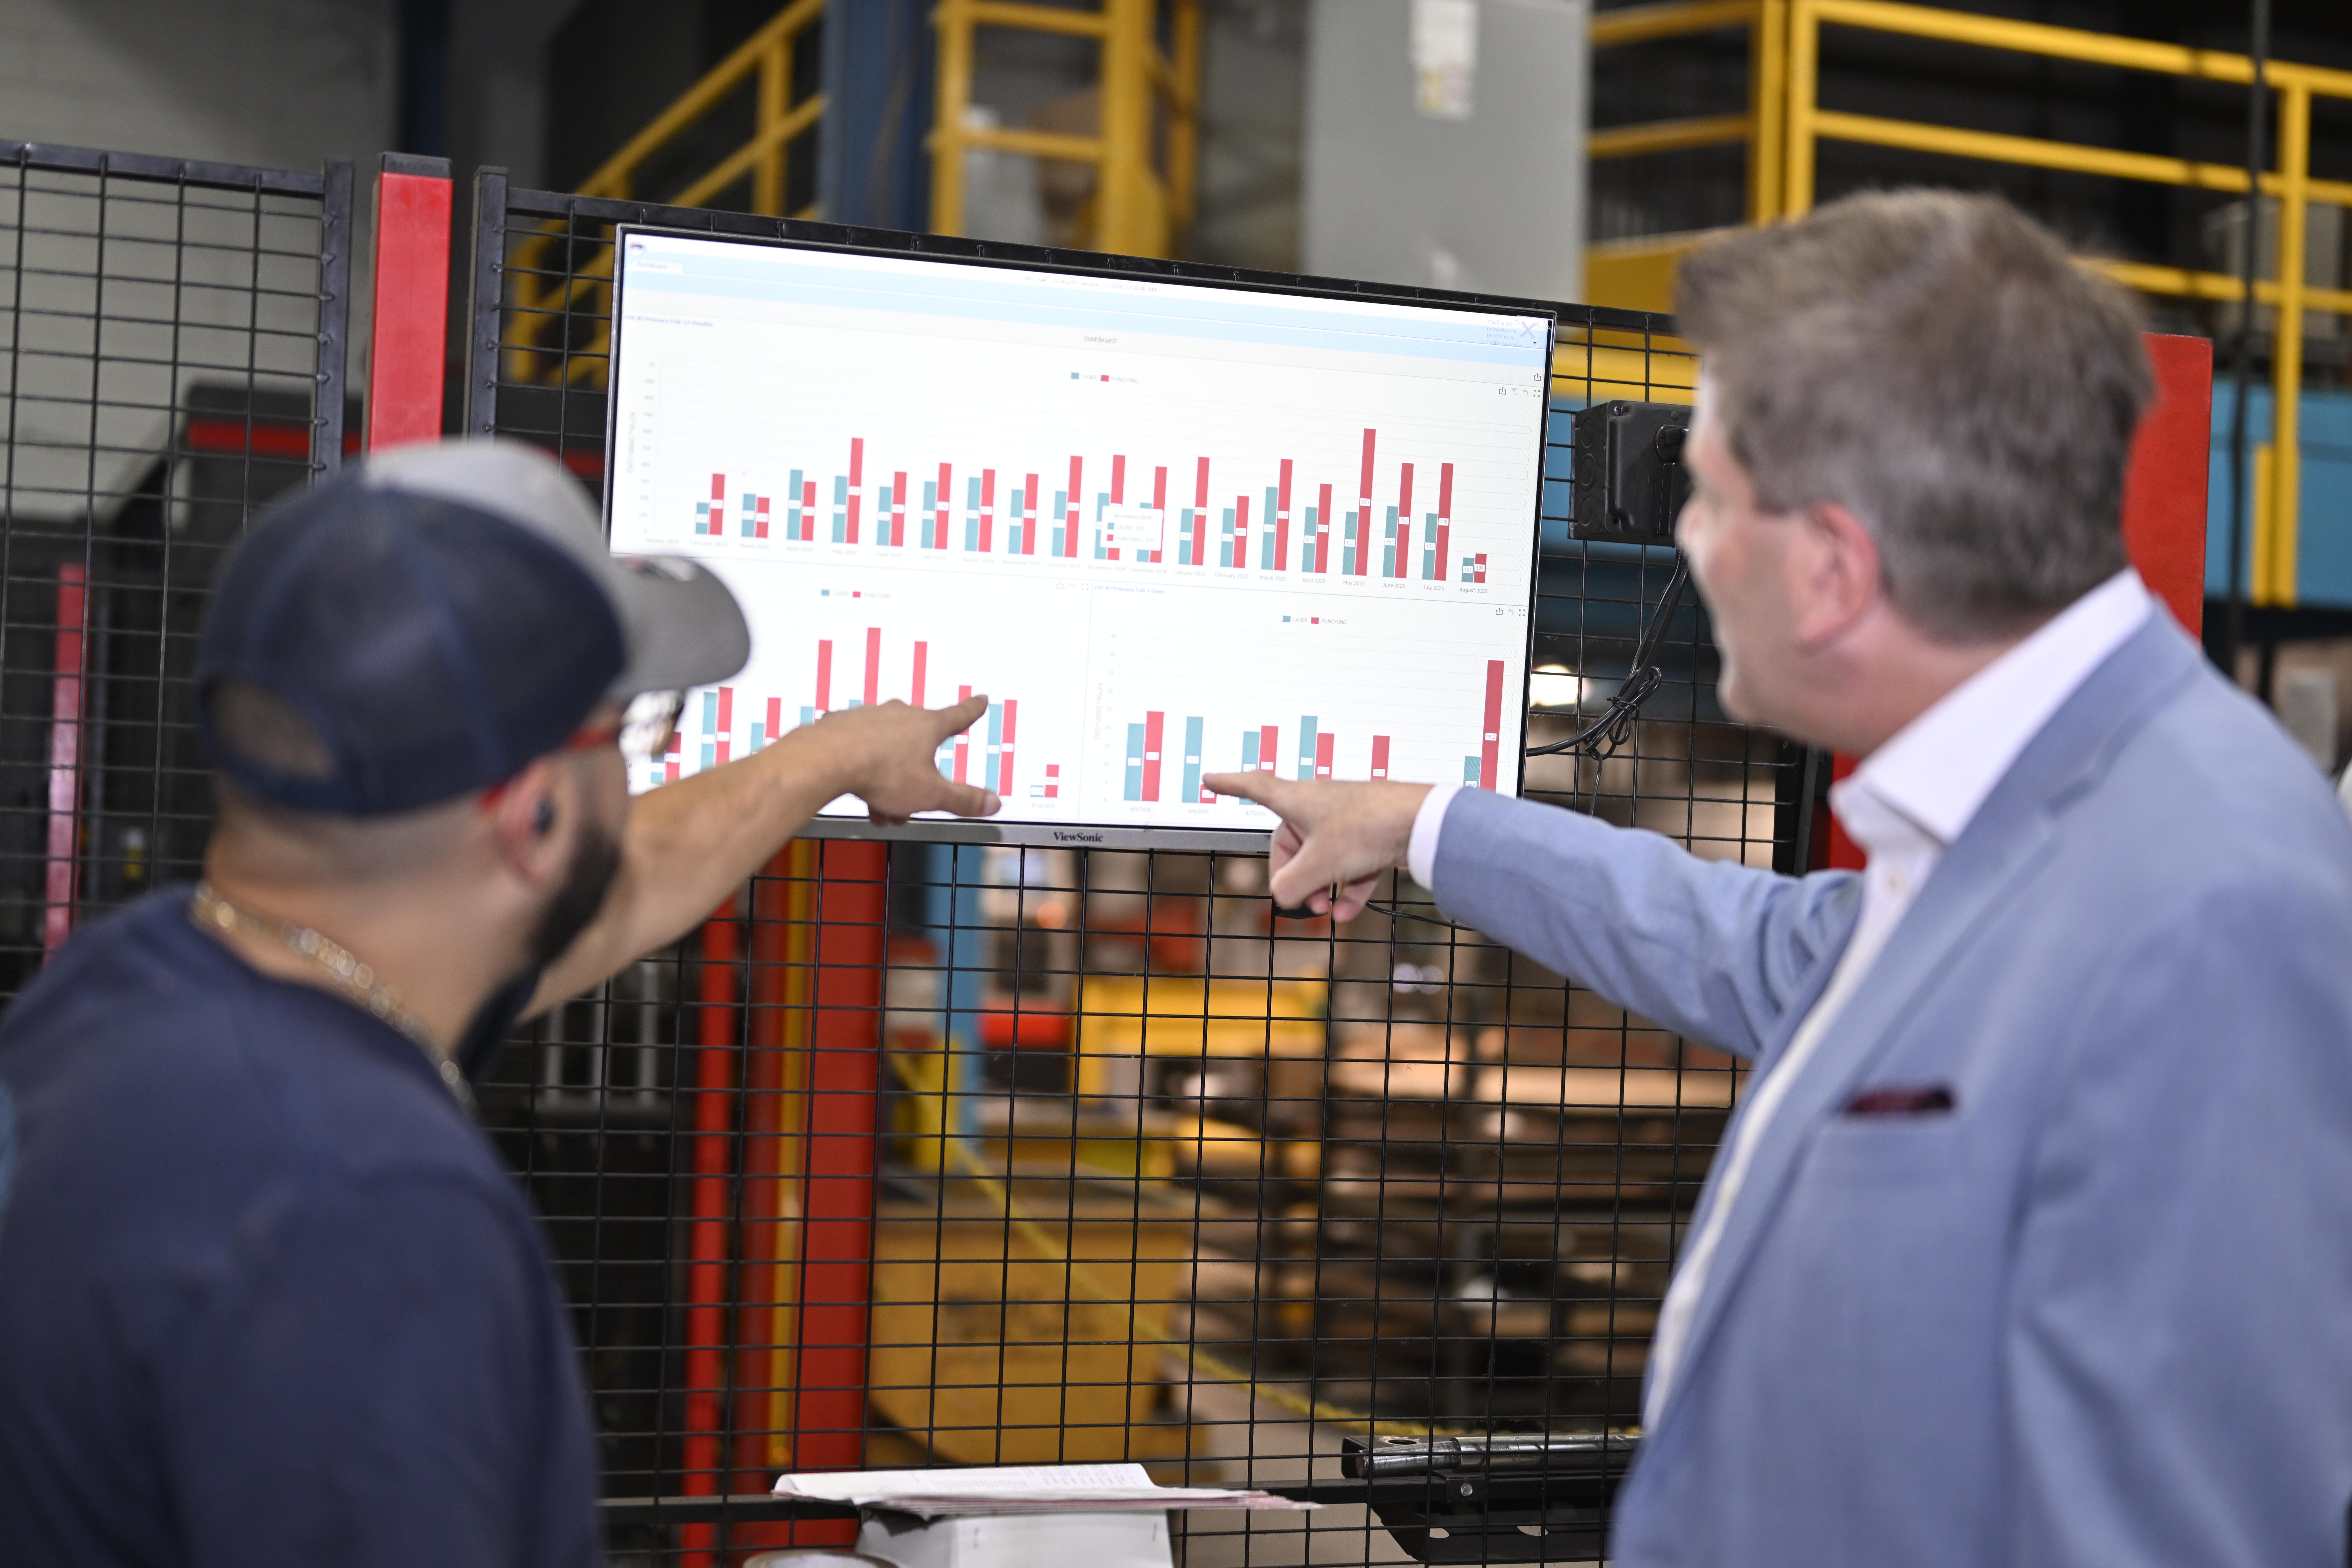
A production KPI dashboard is only as useful as the decisions it drives. Design for glanceability first—place top-line metrics like OEE, throughput, and cost per part at the top, trend lines and exceptions in the middle, and drill-downs for root-cause analysis below. This hierarchy lets anyone glance at the screen and grasp overall status within five seconds.
Cognitive overload is a real risk. Human working memory holds 5-9 items, so keep each dashboard view focused on the metrics that matter most to that specific audience. More is not better here. A cluttered dashboard gets ignored.
Color coding helps—but only when used with discipline. Green, amber, and red provide instant status recognition, but reserve red strictly for items that require immediate action. Overuse it and operators stop reacting to it.
Role-specific views are equally important:
– Shop floor operators need large, high-contrast visuals showing current machine status and target counts.
– Shift supervisors need comparative views across multiple lines to identify where things are falling behind.
– Operations directors need rolled-up KPIs with drill-down capability to investigate exceptions without leaving the dashboard.
When each role sees only what’s relevant to their decisions, the dashboard becomes a tool people actually use—not something they check once a week.
Visualization Best Practices for Manufacturing Data
Match the visual to the purpose of the data. Not every metric belongs in a bar chart.
– Bar charts compare machines, stations, or production lines effectively. – Line charts track trends across shifts, days, or weeks. – Gauges and scorecards show real-time performance against targets. – Pareto charts identify the leading causes of downtime and scrap. – Heatmaps display machine utilization by shift at a glance. – Sparklines show recent performance trends without taking up much screen space.
Accessibility matters too. Color blindness affects a significant portion of users, so pair color coding with symbols or labels rather than relying on color alone. Test contrast ratios before finalizing your design—what looks clear on a monitor may be unreadable on a shop floor screen under bright lighting.
Mobile Access and Real-Time Updates
Your manufacturing production software should not be confined to a single workstation. Dashboards need to reach supervisors on tablets and managers reviewing data remotely. At the same time, place large monitors throughout the shop floor so production teams always have visibility without leaving their station.
Real-time data updates are what separate a useful dashboard from an expensive reporting tool. When conditions change on the shop floor, the dashboard should reflect that immediately—not at the end of the shift. Production scheduling software for manufacturing eliminates the information delays that traditionally slow down response times and let small problems grow into costly ones.
Troubleshooting and Optimizing Your Unified KPI System
Even a well-built KPI system needs ongoing attention. Data inconsistencies creep in, dashboards slow down, and metrics that made sense at launch may no longer reflect your priorities. Here’s how to address each of these issues before they undermine the work you’ve put in.
Resolving Data Inconsistencies
Conflicting numbers erode trust faster than no numbers at all. When your production team reports one throughput figure and your finance team reports another, people stop believing either one—and decisions stall.
The fix starts with accountability. Implement validation workflows that verify accuracy before information reaches decision-makers. Every metric should have a single owner—someone responsible for ensuring that what the system reports is what actually happened on the floor. Without that ownership, teams assume someone else is catching the errors. Nobody is.
It also helps to trace the inconsistency back to its source. More often than not, the problem isn’t the data itself—it’s that two departments are pulling from two different systems and calling the same thing by different names. Standardizing your definitions, as covered in the planning stage, prevents most of these disputes before they start.
Improving Dashboard Performance
A slow dashboard is a dashboard nobody uses. Speed matters more than design—if your team has to wait ten seconds for a screen to load, they’ll default back to spreadsheets.
A few practical fixes:
- Filter data at the source rather than pulling everything and slicing it afterward.
- Pre-aggregate calculations that are accessed frequently, so the system isn’t recomputing the same figures on every load.
- Reduce unnecessary joins between data tables—each one adds processing time.
- Monitor query execution times regularly and fix the slowest-loading dashboards first, particularly those used by executives and production managers.
Clutter is also a performance issue—not just a visual one. Dashboards overloaded with metrics take longer to render and longer to interpret. Keep each view focused.
Expanding Your KPI Coverage Over Time
Your KPI framework isn’t a finished product. It’s a starting point. As your business grows, your metrics need to grow with it.
Start with the high-impact manufacturing KPIs you defined early on, then add new metrics as your team becomes comfortable with the system. Review your full KPI set periodically—at least once a quarter—to confirm each metric still reflects something meaningful. If a KPI isn’t driving decisions, it’s just adding noise.
Measuring ROI of Your Unified System
ROI comes down to a straightforward calculation: net benefits divided by initial investment. Net benefits from your manufacturing production software include time saved on reporting, cost reductions from fewer errors, and revenue gains from faster, better-informed decisions.
Track both types of returns:
- Direct gains: Hours saved on manual data consolidation, reduced rework from faster defect detection, fewer missed deadlines.
- Indirect gains: Faster response to production bottlenecks, better visibility into resource utilization, stronger customer relationships built on reliable delivery data.
The indirect gains are harder to quantify but often larger in impact. When your team shifts from chasing numbers to acting on them, the value compounds over time.
Conclusion
You now have a complete roadmap to transform disconnected metrics into a unified KPI system that drives real decisions. Start with your most critical manufacturing kpis and expand gradually as your team gains confidence with the new system.
Data quality and cross-functional alignment matter more than technical complexity. Pick the right manufacturing production scheduling software, standardize your definitions, and build dashboards that actually get used daily. Most important, remember that unified KPIs are tools for action, not just reporting.
Keep refining your production kpi dashboard based on feedback from the shop floor. Your ROI will grow as teams shift from collecting data to acting on it.
Frequently Asked Questions
Start by creating a list of potential KPIs organized by category (customer value, company value, employee value). Narrow this down to the most impactful metrics, then determine measurement methods for each one. Set specific targets and establish regular review and reporting schedules. Begin with a small set of high-impact metrics and expand gradually as your team gains confidence with the system.
Traditional KPIs operate in isolation across different systems and departments, requiring manual consolidation and creating reporting delays. Unified KPIs pull from a centralized data repository where production events, quality checks, and equipment performance connect automatically in real-time. This eliminates manual data transfer, reduces errors, and enables immediate visibility into how one metric affects others across the entire operation.
Popular choices include Power BI combined with Microsoft platforms for customizable dashboards, Ignition and Kepware for machine connectivity and data visualization, and specialized MES systems like Siemens OpCenter Execution. For smaller operations, tools like JobBoss handle inventory, scheduling, and purchasing, while some manufacturers successfully build custom solutions using low-code platforms like AppSheet to avoid high per-user licensing costs.
Implement validation workflows that verify data accuracy before it reaches decision-makers. Establish single ownership for each metric to eliminate accountability gaps. Standardize data formats across all systems to enable easy data exchange and eliminate duplication. Use a centralized repository that enables real-time access while maintaining data integrity across departments.
Design for quick comprehension by placing top-line KPIs like OEE and throughput at the top, trend lines in the middle, and drill-down details below. Limit metrics per screen to 5-9 items to avoid cognitive overload. Use consistent color coding sparingly to highlight exceptions requiring action. Create role-specific views so operators, supervisors, and executives each see the metrics most relevant to their decisions, and ensure the dashboard updates in real-time.